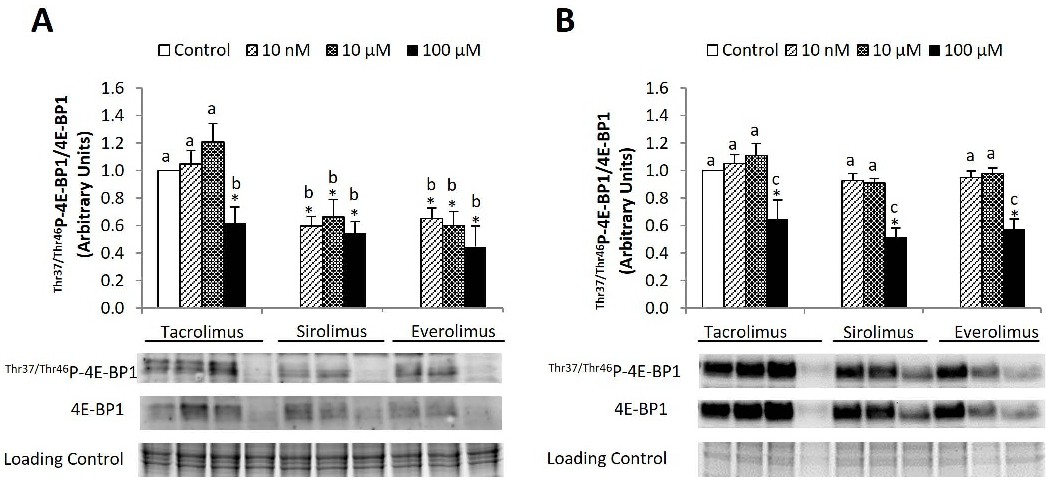
Fig. 3. Thr37/Thr46P-4E-BP1/4E-BP1 ratio in Tacrolimus-, Sirolimus- and Everolimus-treated HepG2 (A) and Huh7 (B) cells. Treatments were administered at different concentrations (0, 10 nM, 10 µM, and 100 µM). The protein expression of Thr37/Thr46P-4E-BP1/4E-BP1 (6 h) was determined by Western‐blot analysis as described in Material and Methods. Results are expressed as mean ± SEM, and blots are representative of four independent experiments. *p ≤ 0.05 between control and immunosuppressant‐treated cells. The groups with different letters (a, b or c) were significantly different (p ≤ 0.05).